Intel VTune Profiler
| Version | Module File Name | System A | System B/C | System G | Cloud System | Note |
|---|---|---|---|---|---|---|
| 2025.3 | intel-vtune/2025.3 | + | + | - | - | |
| 2025.0 | intel-vtune/2025.0 | + | + | - | - | |
| 2024.0 | intel-vtune/2024.0 | + | + | - | - | |
| 2023.2 (default) | intel-vtune/2023.2 | + | + | - | - | |
| 2023.1 | intel-vtune/2023.1 | + | + | - | - | |
| 2022.3 | intel-vtune/2022.3 | + | + | - | - |
+: Available for all users
- : Not available
In the Intel compiler available environment, execute the module command as follows.
$ module load intel-vtuneFor details on the module command, please refer to Modules.
| Commands | Purpose |
|---|---|
| vtune-gui | Acrivate the GUI version of the VTune Profiler. |
| vtune | Activate the command line version of the VTune Profiler. |
| Options | Purpose |
|---|---|
| -collect=string | Specifies the analysis type. |
| -app-working-dir=string | Specifies the working directory. |
| -r, -result-dir=string | Specifies the directory in which to save the result. |
| Types | Purpose |
|---|---|
| threading | Displays multi-threaded parallelism. |
| hotspots | Analyze hotspots. |
| memory-access | Analyze memory access. |
-
Compiling
When using the Intel VTune Profiler, compile with debugging options -g and the same optimization options as for the actual program execution.$ icc -g -O2 test.c -
Activating VTune Profiler
In MobaXterm or FastX, the VTune Amplifier is activated when executing the vtune-gui command. Please refer to Interactive Processing for details on the tssrun command.$ tssrun --x11 vtune-gui
-
Creating projects
Select New Project in the center of the screen and the following screen will appear. Then enter the appropriate Project name and click Create Project.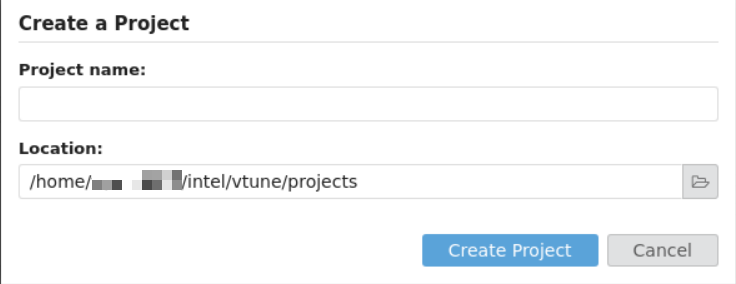
-
Setting projects
Next, the Configure Analysis screen will appear. Specify the target program in Application and click OK. If an arguments is required, specify it here.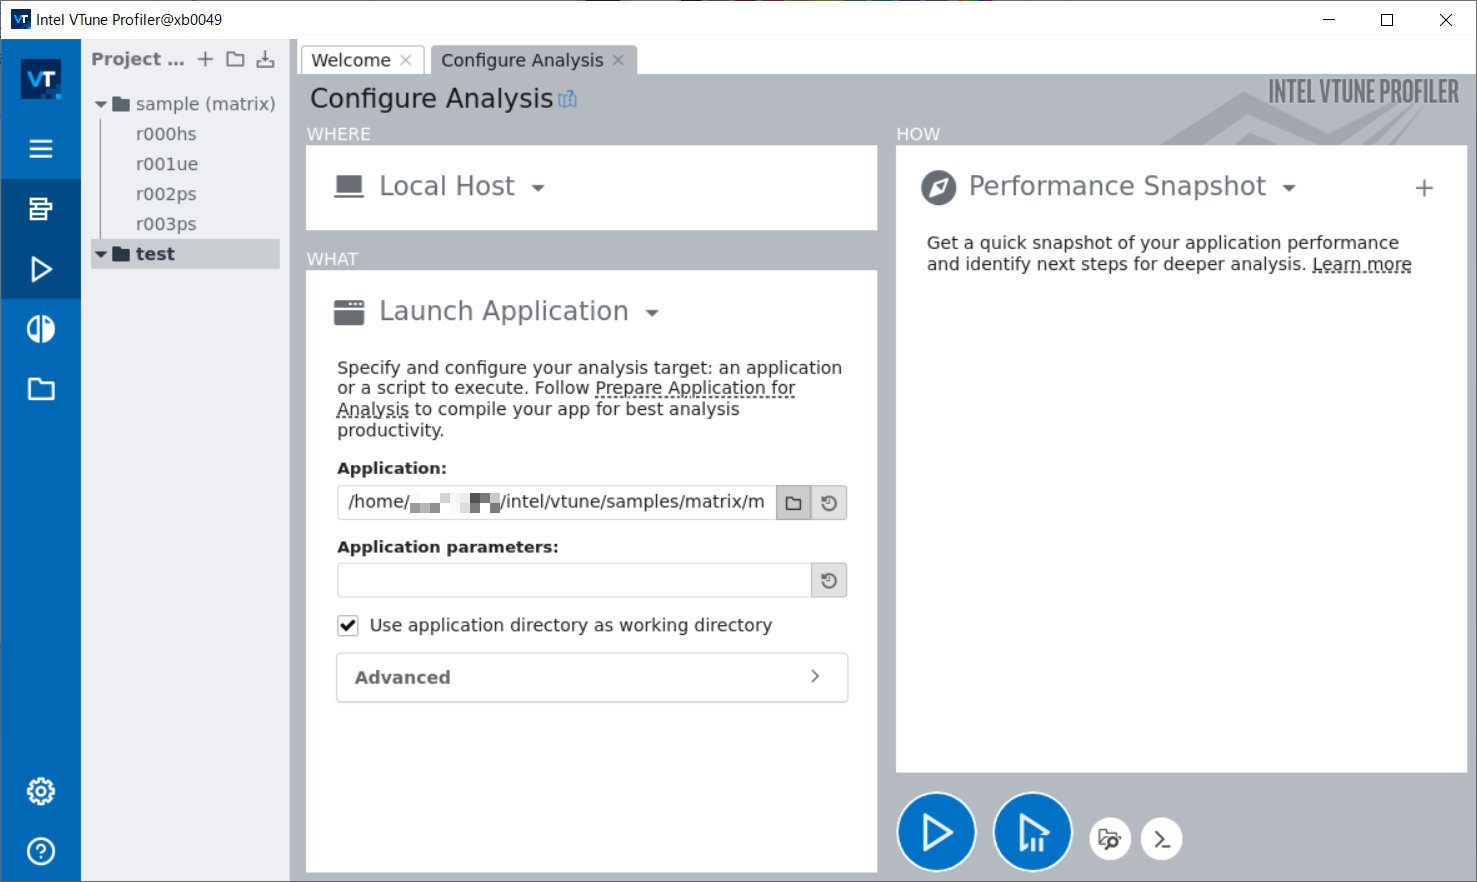
-
Start Analysis
Click Performance Snapshot, specify the target of the check, and then press Start with the triangle symbol.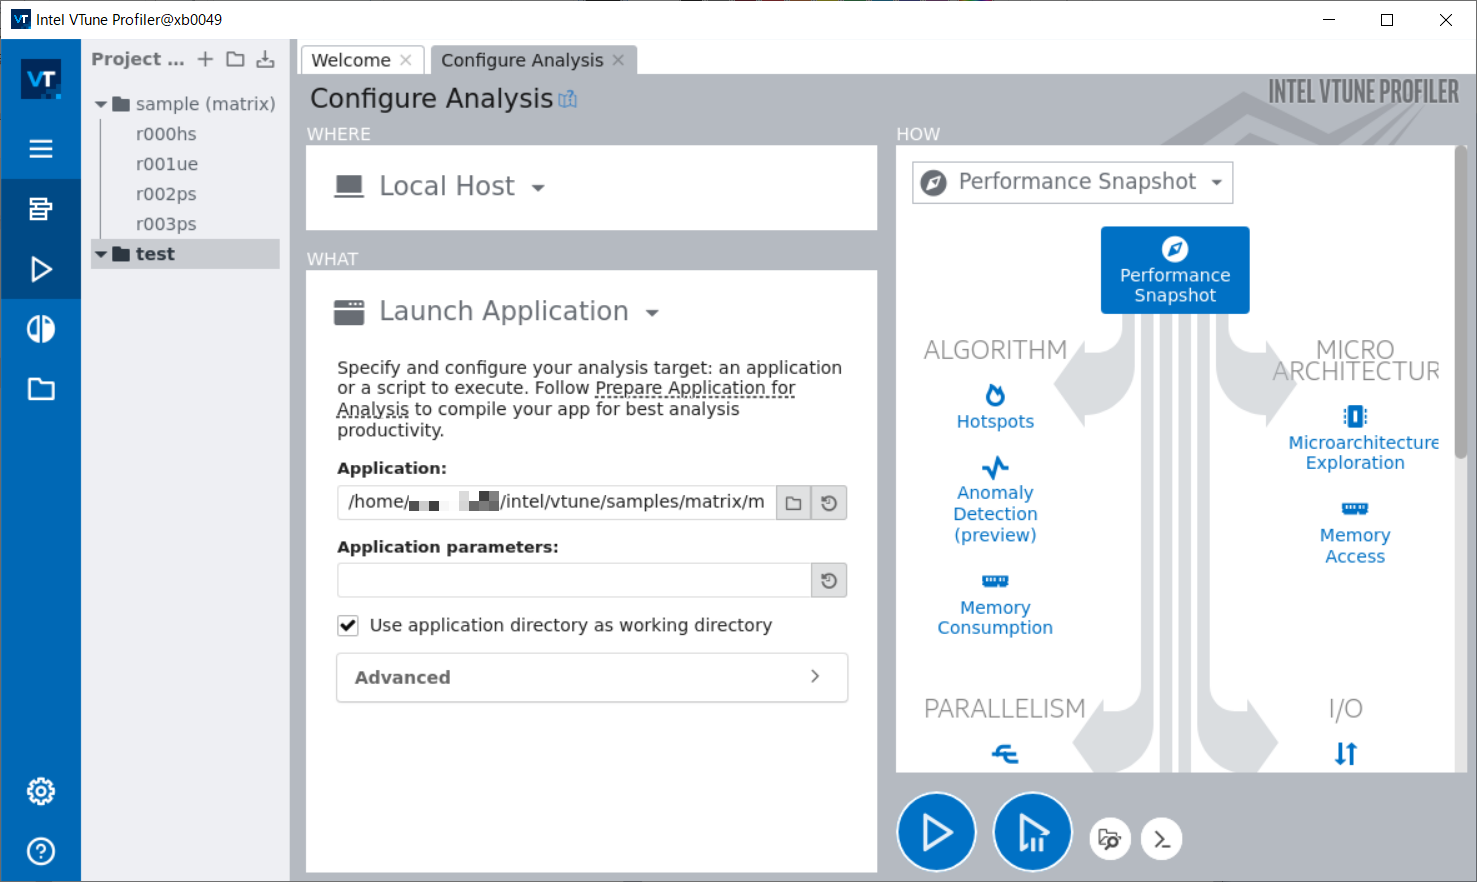
-
Confirmation of analysis results
After a short wait, the results of the analysis in the VTune Profiler are displayed. In this example, we can see that the multiply1 function is using a lot of CPU time.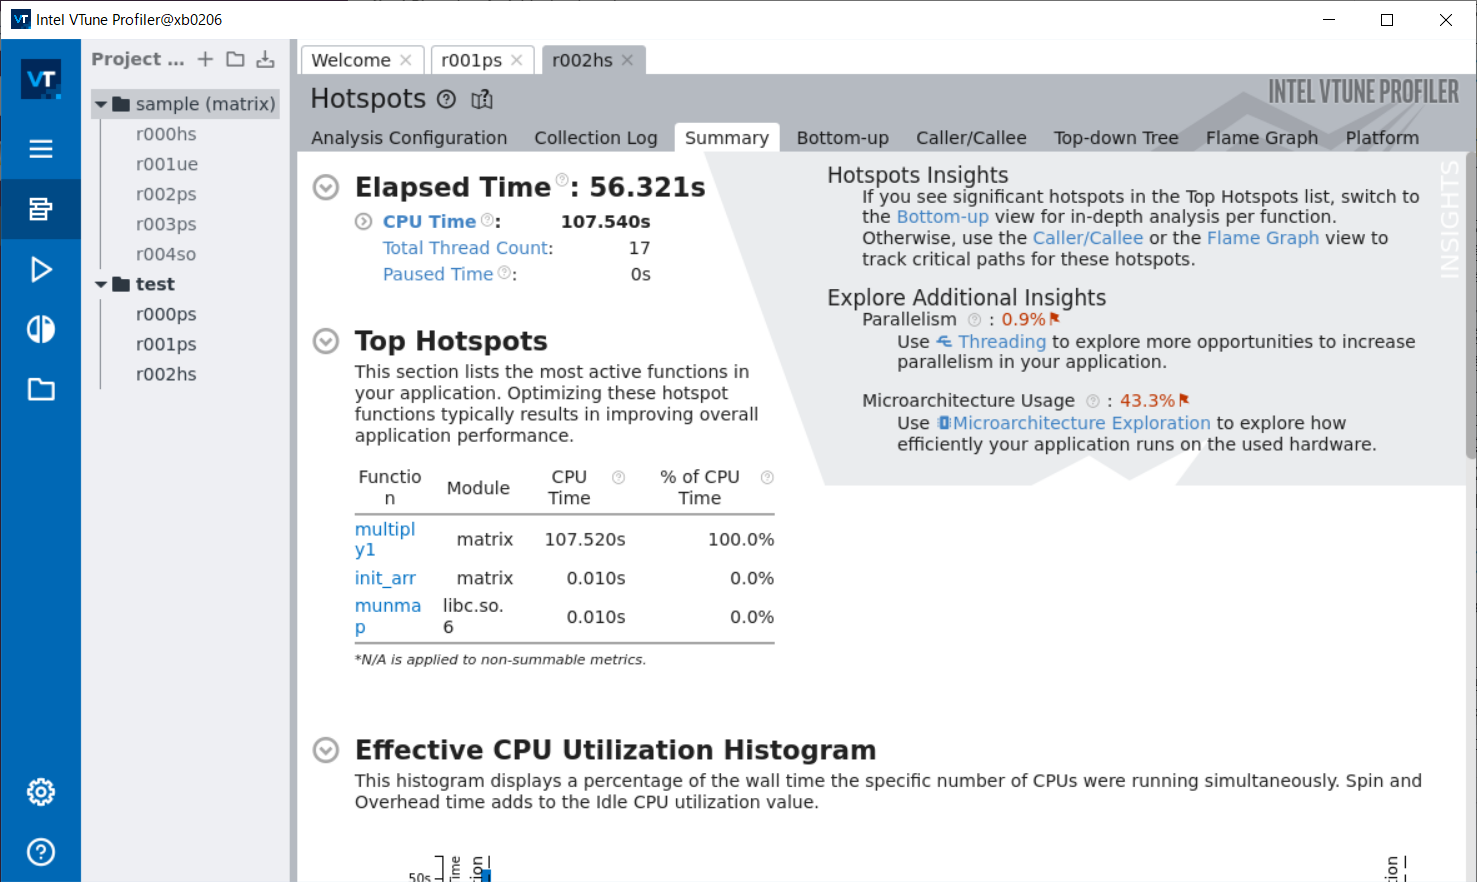
The GUI version supports analysis of OpenMP programs.
When starting with the tssrun command, the --rsc option specifies the number of threads.
Example:8 threads execution
tssrun --x11 --rsc t=8:c=8 vtune-guiPlease use the CUI version for an analysis of MPI program.
-
Compiling
When using Intel VTune Profiler, compile with debugging options -g and the same optimization options as for the actual program execution.$ icc -g -O2 test.c -
Executing Check
A CUI version of the VTune Profiler is available with the vtune command. In this example, we are analyzing hotspots by specifying the directory to output the results. Please refer to Interactive Processing for details on the tssrun command.
$ tssrun vtune -collect hotspots  -r=./result.vtune ./a.out
salloc: Pending job allocation 723318
salloc: job 723318 queued and waiting for resources
salloc: job 723318 has been allocated resources
salloc: Granted job allocation 723318
salloc: Waiting for resource configuration
salloc: Nodes xb0013 are ready for job
vtune: Analyzing data in the node-wide mode. The hostname (xb0013) will be added to the result path/name.
vtune: Collection started.

(Omitted)

vtune: Executing actions 42 % Saving the resultElapsed Time: 0.075s
 | Application execution time is too short. Metrics data may be unreliable.
 | Consider reducing the sampling interval or increasing your application
 | execution time.
 |
    CPU Time: 0.050s
        Effective Time: 0s
        Spin Time: 0s
            Imbalance or Serial Spinning: 0s
            Lock Contention: 0s
            Other: 0s
        Overhead Time: 0.050s
         | A significant portion of CPU time is spent in synchronization or
         | threading overhead. Consider increasing task granularity or the scope
         | of data synchronization.
         |
            Creation: 0s
            Scheduling: 0s
            Reduction: 0s
            Atomics: 0s
            Other: 0.050s
    Total Thread Count: 1
    Paused Time: 0s

Top Hotspots
Function                       Module       CPU Time  % of CPU Time(%)
-----------------------------  -----------  --------  ----------------
__kmp_api_omp_get_max_threads  libiomp5.so    0.050s            100.0%
Effective Physical Core Utilization: 100.0% (112.000 out of 112)
    Effective Logical Core Utilization: 148.8% (333.230 out of 224)
Collection and Platform Info
    Application Command Line: ../oss/openmp/omp-sample/01_hello/src/c/run.x
    Operating System: 4.18.0-477.15.1.el8_8.x86_64 Red Hat Enterprise Linux release 8.8 (Ootpa)
    Computer Name: xb0013
    Result Size: 5.5 MB
    Collection start time: 09:39:56 21/09/2023 UTC
    Collection stop time: 09:39:57 21/09/2023 UTC
    Collector Type: Event-based counting driver,User-mode sampling and tracing
    CPU
        Name: Intel(R) Xeon(R) Processor code named Sapphirerapids
        Frequency: 2.000 GHz
        Logical CPU Count: 224
        LLC size: 110.1 MB
        Cache Allocation Technology
            Level 2 capability: available
            Level 3 capability: available

If you want to skip descriptions of detected performance issues in the report,
enter: vtune -report summary -report-knob show-issues=false -r <my_result_dir>.
Alternatively, you may view the report in the csv format: vtune -report
<report_name> -format=csv.
vtune: Executing actions 100 % done
salloc: Relinquishing job allocation 723318

exit code: 0-
Checking the results
Execute the vtune-gui command in the X (GUI) available environment, such as MobaXterm or FastX, and check the results with the GUI version of VTune Amplifier. Please refer to Interactive Processing for details on the tssrun command.$ tssrun --x11 vtune-gui ./result/result.vtune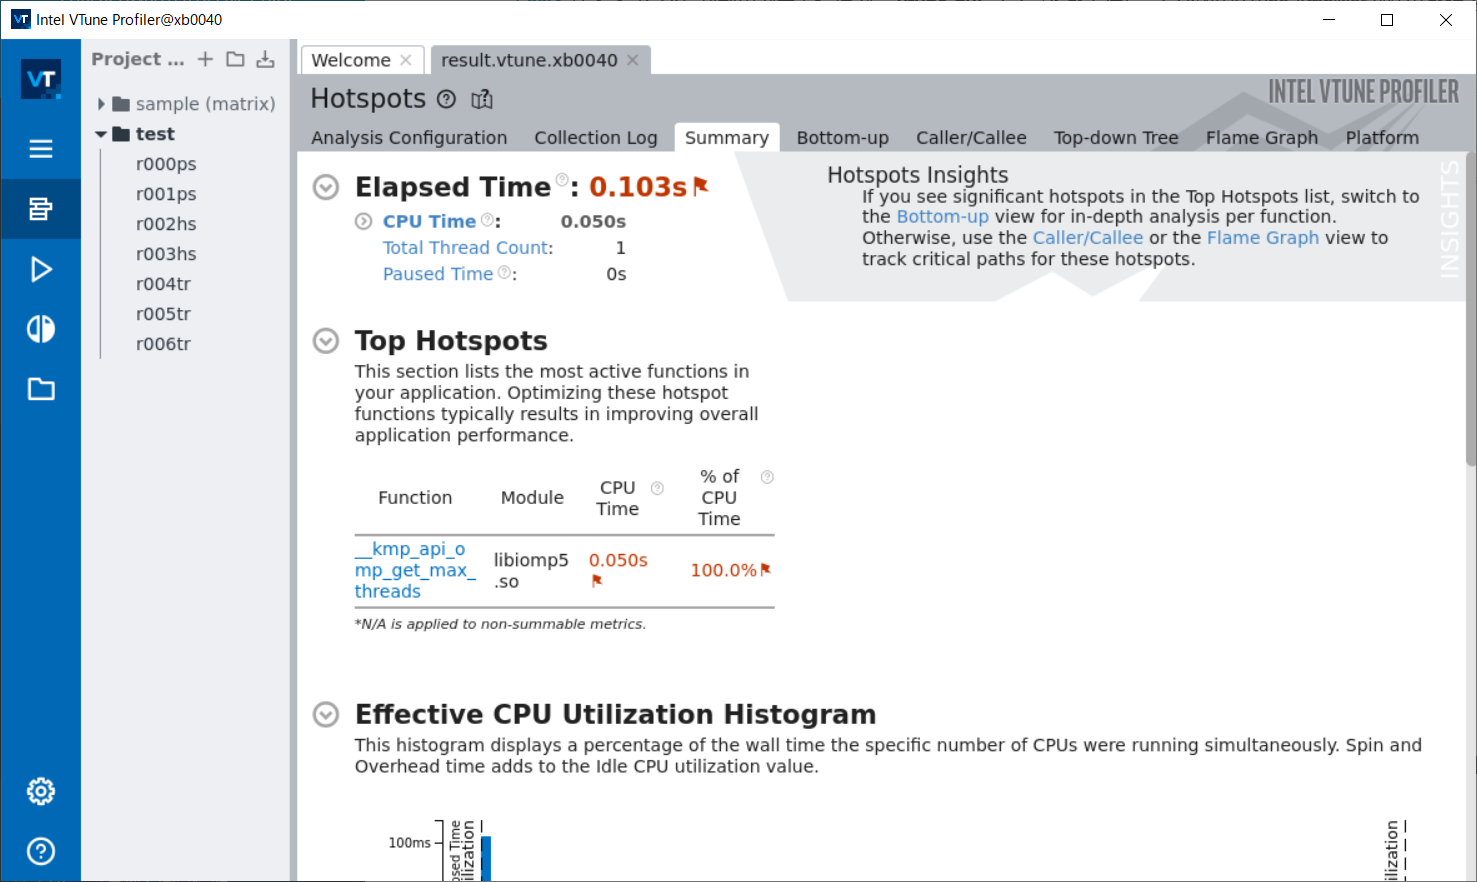
The CUI version supports analysis of MPI and OpenMP programs. When executing VTune with tssrun, the --rsc option specifies the number of parallels.
Example: Analysis with MPI4 parallel
$ tssrun --rsc p=4 vtune -collect hotspots  -r=./result ./a.out
salloc: Pending job allocation 723080
salloc: job 723080 queued and waiting for resources
salloc: job 723080 has been allocated resources
salloc: Granted job allocation 723080
vtune: Analyzing data in the node-wide mode. The hostname (xb0127) will be added to the result path/name.
vtune: Collection started.

(Omitted)

vtune: ExecutinElapsed Time: 1.015sg the result
    CPU Time: 1.710s
        Effective Time: 1.710s
        Spin Time: 0s
            MPI Busy Wait Time: 0s
            Other: 0s
        Overhead Time: 0s
            Other: 0s
    Total Thread Count: 8
    Paused Time: 0s

Top Hotspots
Function                Module                CPU Time  % of CPU Time(%)
----------------------  --------------------  --------  ----------------
read                    libc.so.6               0.670s             39.2%
PMPI_Init               libmpi.so.12            0.112s              6.6%
main                    allrank                 0.100s              5.8%
dlopen                  libdl.so.2              0.089s              5.2%
[ld-linux-x86-64.so.2]  ld-linux-x86-64.so.2    0.080s              4.7%
[Others]                N/A                     0.658s             38.5%
Effective Physical Core Utilization: 89.5% (100.261 out of 112)
    Effective Logical Core Utilization: 45.0% (100.843 out of 224)
     | The metric value is low, which may signal a poor utilization of logical
     | CPU cores while the utilization of physical cores is acceptable. Consider
     | using logical cores, which in some cases can improve processor throughput
     | and overall performance of multi-threaded applications.
     |
Collection and Platform Info
    Application Command Line: ../lecture/20230906/mpi/allrank
    Operating System: 4.18.0-477.15.1.el8_8.x86_64 Red Hat Enterprise Linux release 8.8 (Ootpa)
    Computer Name: xb0127
    Result Size: 7.2 MB
    Collection start time: 09:24:37 21/09/2023 UTC
    Collection stop time: 09:24:38 21/09/2023 UTC
    Collector Type: Event-based counting driver,User-mode sampling and tracing
    CPU
        Name: Intel(R) Xeon(R) Processor code named Sapphirerapids
        Frequency: 2.000 GHz
        Logical CPU Count: 224
        LLC size: 110.1 MB
        Cache Allocation Technology
            Level 2 capability: available
            Level 3 capability: available

If you want to skip descriptions of detected performance issues in the report,
enter: vtune -report summary -report-knob show-issues=false -r <my_result_dir>.
Alternatively, you may view the report in the csv format: vtune -report
<report_name> -format=csv.
vtune: Executing actions 100 % done
salloc: Relinquishing job allocation 723080

exit code: 0