Intel VTune Profiler
| バージョン | モジュールファイル名 | システムA | システムB/C | システムG | クラウドシステム | 備考 |
|---|---|---|---|---|---|---|
| 2025.3 | intel-vtune/2025.3 | + | + | - | - | |
| 2025.0 | intel-vtune/2025.0 | + | + | - | - | |
| 2024.0 | intel-vtune/2024.0 | + | + | - | - | |
| 2023.2 (default) | intel-vtune/2023.2 | + | + | - | - | |
| 2023.1 | intel-vtune/2023.1 | + | + | - | - | |
| 2022.3 | intel-vtune/2022.3 | + | + | - | - |
+: すべてのユーザが利用可能
- : 利用不可
Intelコンパイラ が利用できる状態で、以下のようにmoduleコマンドを実行してください。
$ module load intel-vtunemoduleコマンドの詳細は Modules をご覧ください。
| コマンド | 説明 |
|---|---|
| vtune-gui | GUI版のVTune Profilerを起動します。 |
| vtune | コマンドライン版のVTune Profilerを起動します。 |
| オプション | 説明 |
|---|---|
| -collect=string | 分析を行うタイプを指定します。 |
| -app-working-dir=string | ワーキングディレクトリを指定します。 |
| -r, -result-dir=string | 結果を保存するディレクトリを指定します。 |
| タイプ | 説明 |
|---|---|
| threading | マルチスレッドの並列性を表示します。 |
| hotspots | ホットスポットを分析します。 |
| memory-access | メモリアクセスを分析します。 |
-
コンパイル
Intel VTune Profilerを使用する場合、デバッグオプション -g と実際のプログラム実行時と同等な最適化オプションを指定してコンパイルを行ってください。$ icc -g -O2 test.c -
VTune Profiler の起動
MobaXterm または FastX で、 vtune-gui コマンドを実行するとVTune Amplifierが起動します。 tssrun コマンドの詳細は 会話型処理 をご覧ください。$ tssrun --x11 vtune-gui
-
プロジェクトを作成する
画面中央の New Project を選択すると以下のような画面が表示されますので、適切な Project name を入力して、 Create Project を押してください。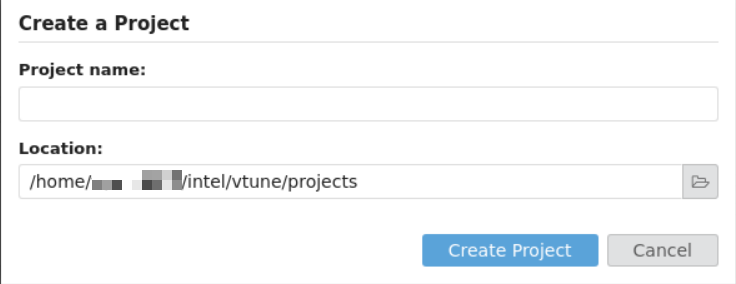
-
プロジェクトの設定
続いて、Configure Analysis の画面が表示されますので、対象とするプログラムを Application で指定して OK を押してください。引数等が必要な場合はここで指定します。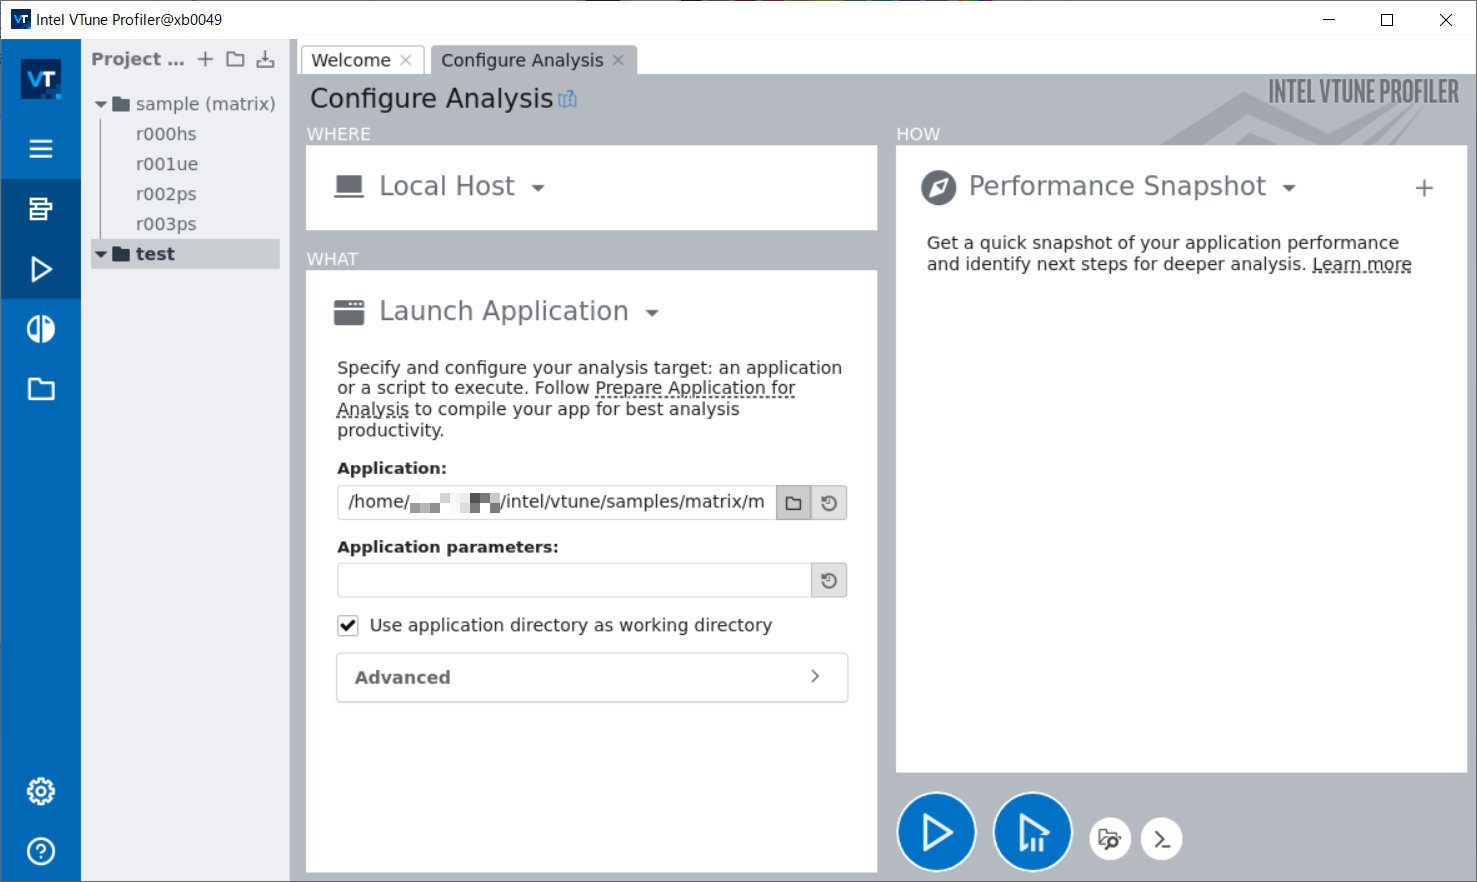
-
分析開始
Performance Snapshot を押して、チェックの対象を指定したうえで、三角マークの Start を押してください。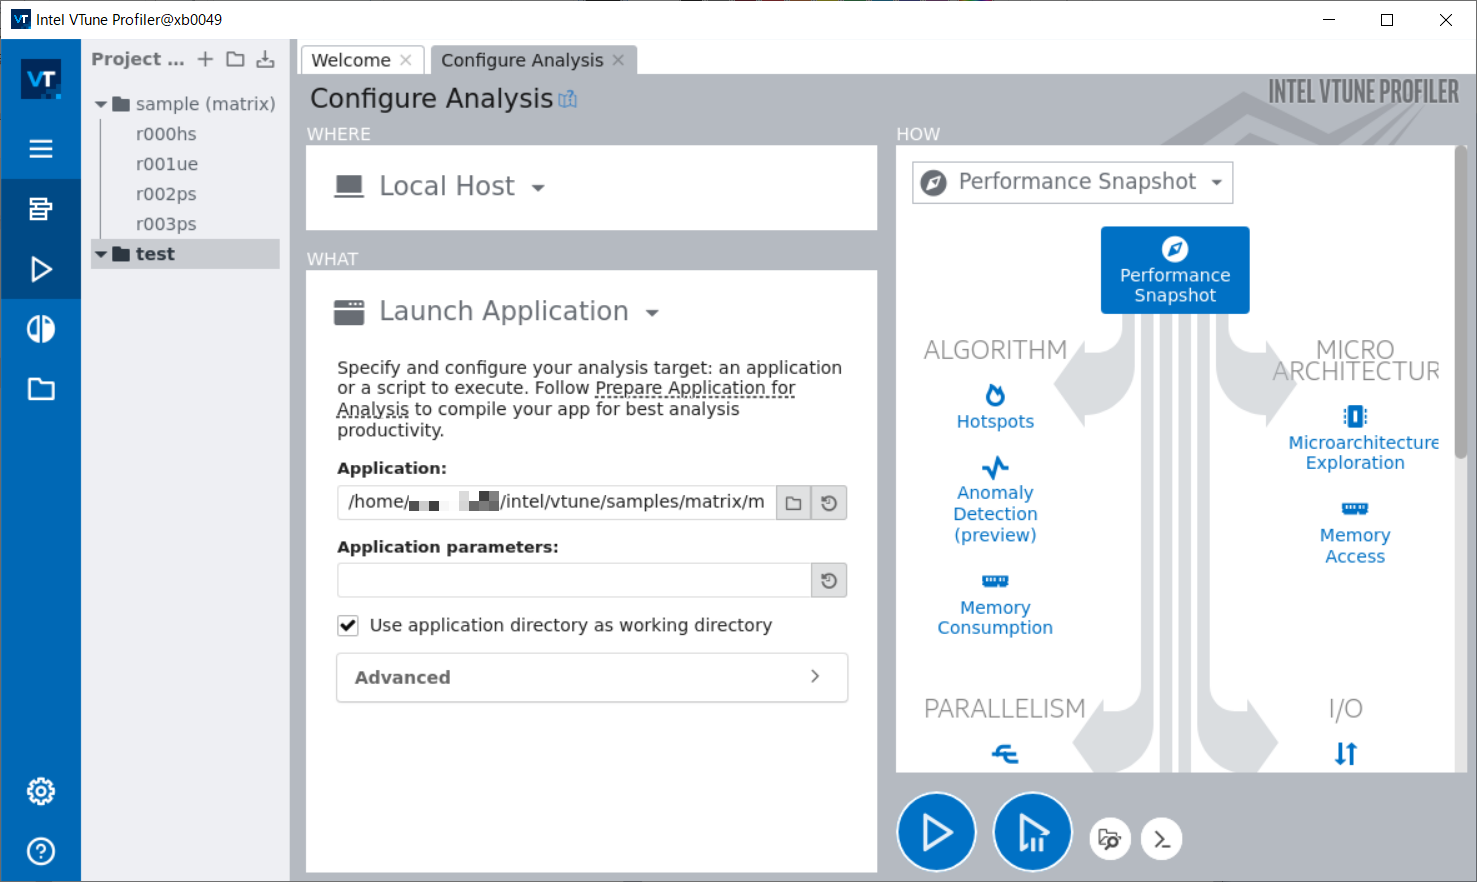
-
分析結果の確認
しばらく待つと、VTune Profilerでの分析結果が表示されます。この例では、multiply1関数がCPU時間を多く使用していることが分かります。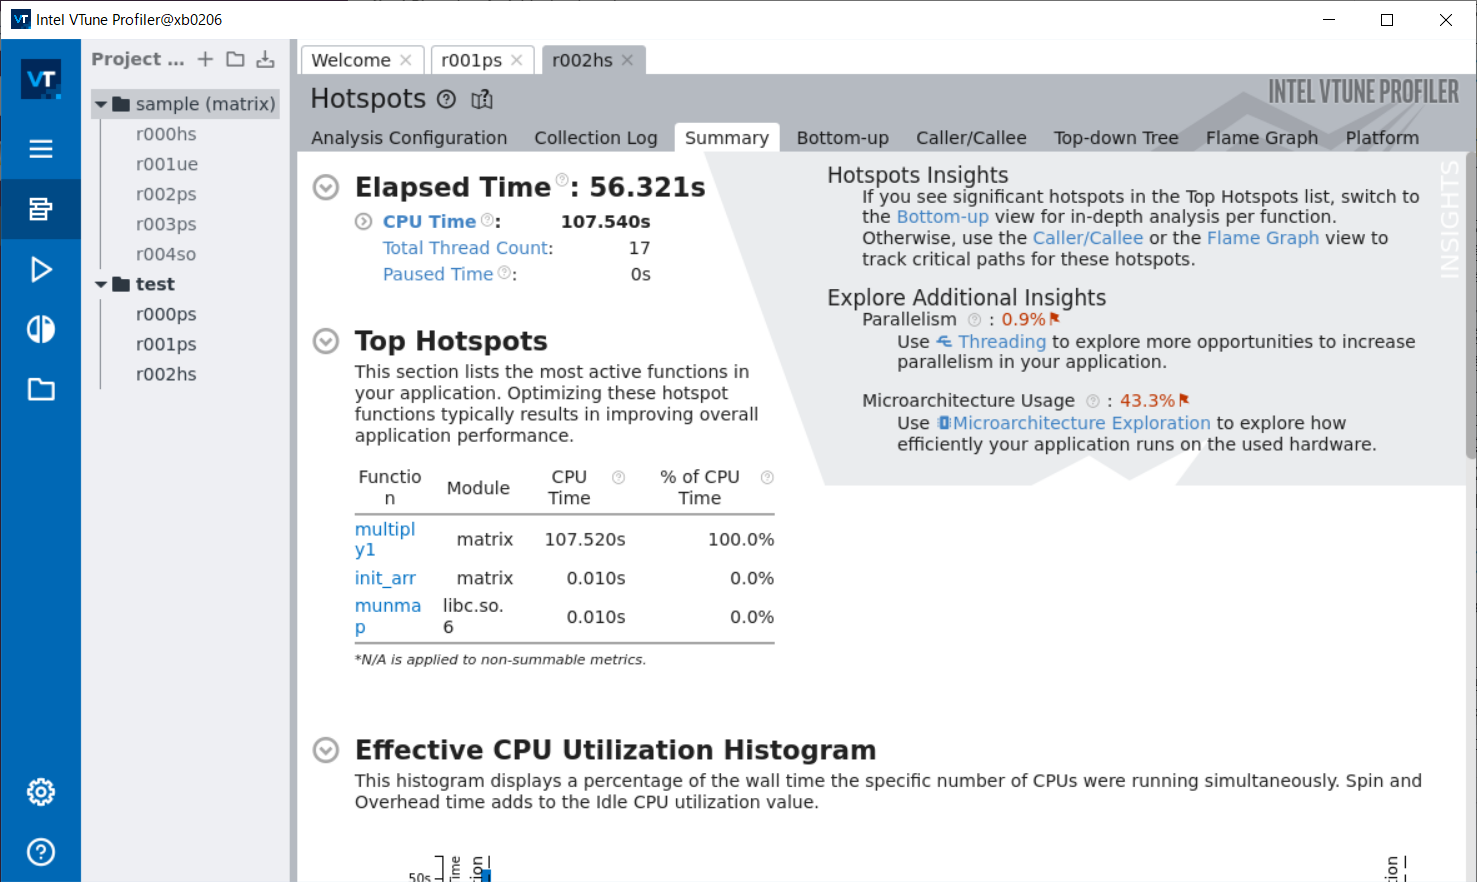
GUI版はOpenMPプログラムの解析に対応しています。 tssrun コマンドで起動時に、--rsc オプションでスレッド数を指定します。
例:8スレッド実行
tssrun --x11 --rsc t=8:c=8 vtune-guiMPIプログラムの解析は、CUI版をご利用ください。
-
コンパイル
Intel VTune Profilerを使用する場合、デバッグオプション -g と実際のプログラム実行時と同等な最適化オプションを指定してコンパイルを行ってください。$ icc -g -O2 test.c -
チェックの実行
CUI版のVTune Profilerは vtune コマンドで利用できます。この例では、結果を出力するディレクトリの指定して、hotspotsの分析をしています。 tssrun コマンドの詳細は 会話型処理 をご覧ください。
$ tssrun vtune -collect hotspots  -r=./result.vtune ./a.out
salloc: Pending job allocation 723318
salloc: job 723318 queued and waiting for resources
salloc: job 723318 has been allocated resources
salloc: Granted job allocation 723318
salloc: Waiting for resource configuration
salloc: Nodes xb0013 are ready for job
vtune: Analyzing data in the node-wide mode. The hostname (xb0013) will be added to the result path/name.
vtune: Collection started.

(略)

vtune: Executing actions 42 % Saving the resultElapsed Time: 0.075s
 | Application execution time is too short. Metrics data may be unreliable.
 | Consider reducing the sampling interval or increasing your application
 | execution time.
 |
    CPU Time: 0.050s
        Effective Time: 0s
        Spin Time: 0s
            Imbalance or Serial Spinning: 0s
            Lock Contention: 0s
            Other: 0s
        Overhead Time: 0.050s
         | A significant portion of CPU time is spent in synchronization or
         | threading overhead. Consider increasing task granularity or the scope
         | of data synchronization.
         |
            Creation: 0s
            Scheduling: 0s
            Reduction: 0s
            Atomics: 0s
            Other: 0.050s
    Total Thread Count: 1
    Paused Time: 0s

Top Hotspots
Function                       Module       CPU Time  % of CPU Time(%)
-----------------------------  -----------  --------  ----------------
__kmp_api_omp_get_max_threads  libiomp5.so    0.050s            100.0%
Effective Physical Core Utilization: 100.0% (112.000 out of 112)
    Effective Logical Core Utilization: 148.8% (333.230 out of 224)
Collection and Platform Info
    Application Command Line: ../oss/openmp/omp-sample/01_hello/src/c/run.x
    Operating System: 4.18.0-477.15.1.el8_8.x86_64 Red Hat Enterprise Linux release 8.8 (Ootpa)
    Computer Name: xb0013
    Result Size: 5.5 MB
    Collection start time: 09:39:56 21/09/2023 UTC
    Collection stop time: 09:39:57 21/09/2023 UTC
    Collector Type: Event-based counting driver,User-mode sampling and tracing
    CPU
        Name: Intel(R) Xeon(R) Processor code named Sapphirerapids
        Frequency: 2.000 GHz
        Logical CPU Count: 224
        LLC size: 110.1 MB
        Cache Allocation Technology
            Level 2 capability: available
            Level 3 capability: available

If you want to skip descriptions of detected performance issues in the report,
enter: vtune -report summary -report-knob show-issues=false -r <my_result_dir>.
Alternatively, you may view the report in the csv format: vtune -report
<report_name> -format=csv.
vtune: Executing actions 100 % done
salloc: Relinquishing job allocation 723318

exit code: 0-
結果の確認
MobaXterm または FastX など X(GUI)が利用できる環境で、 vtune-gui コマンドを実行し、GUI版のVTune Amplifierで結果を確認してください。 tssrun コマンドの詳細は 会話型処理 をご覧ください。$ tssrun --x11 vtune-gui ./result/result.vtune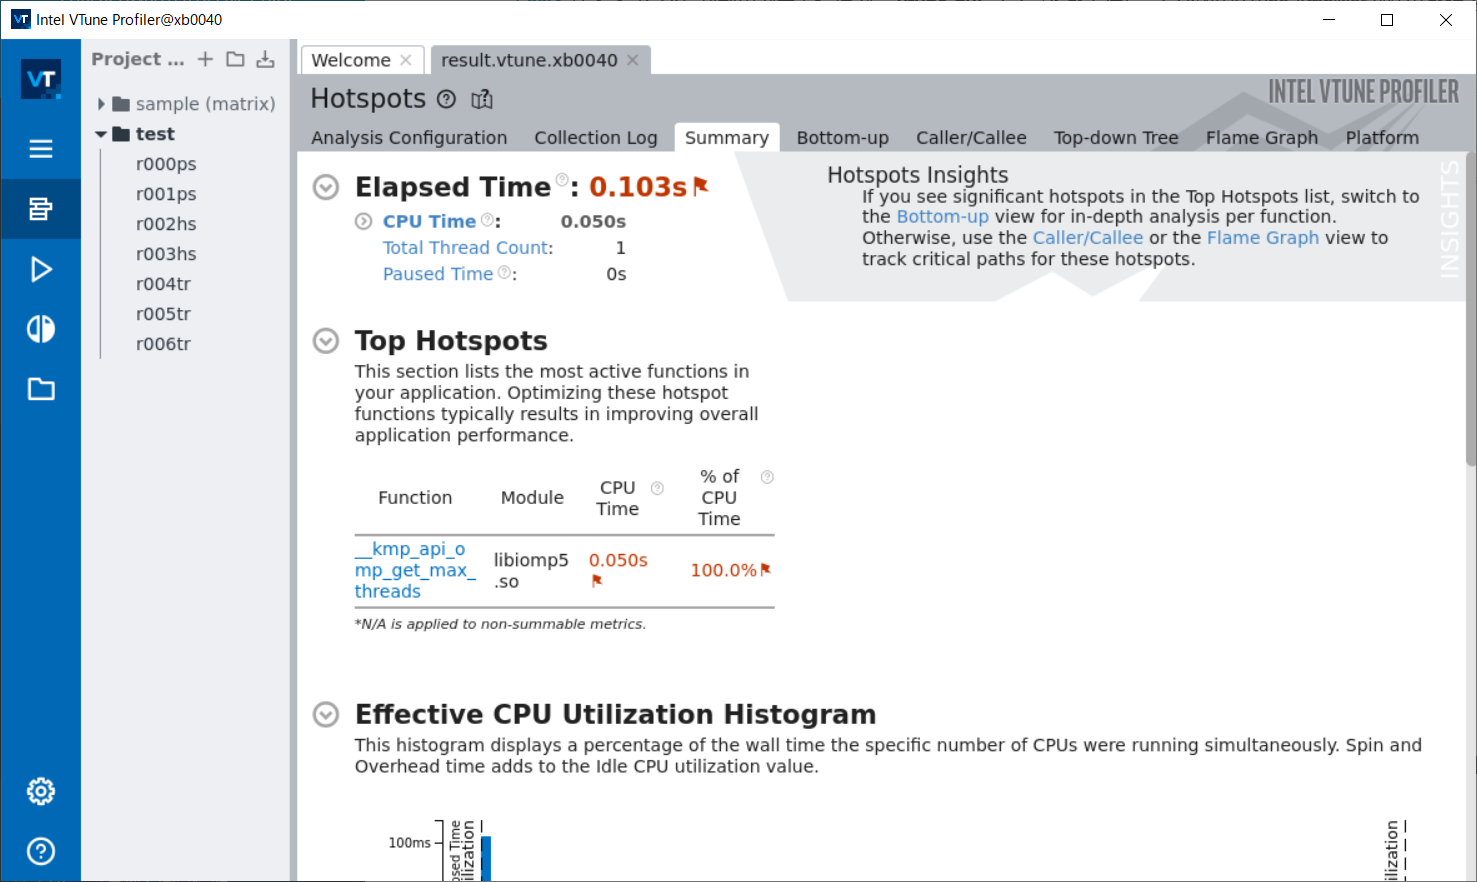
CUI版はMPIおよびOpenMPプログラムの解析に対応しています。 tssrunでVTuneを実行の際、--rsc オプションで並列数を指定します。
例:MPI4並列で解析
$ tssrun --rsc p=4 vtune -collect hotspots  -r=./result ./a.out
salloc: Pending job allocation 723080
salloc: job 723080 queued and waiting for resources
salloc: job 723080 has been allocated resources
salloc: Granted job allocation 723080
vtune: Analyzing data in the node-wide mode. The hostname (xb0127) will be added to the result path/name.
vtune: Collection started.

(略)

vtune: ExecutinElapsed Time: 1.015sg the result
    CPU Time: 1.710s
        Effective Time: 1.710s
        Spin Time: 0s
            MPI Busy Wait Time: 0s
            Other: 0s
        Overhead Time: 0s
            Other: 0s
    Total Thread Count: 8
    Paused Time: 0s

Top Hotspots
Function                Module                CPU Time  % of CPU Time(%)
----------------------  --------------------  --------  ----------------
read                    libc.so.6               0.670s             39.2%
PMPI_Init               libmpi.so.12            0.112s              6.6%
main                    allrank                 0.100s              5.8%
dlopen                  libdl.so.2              0.089s              5.2%
[ld-linux-x86-64.so.2]  ld-linux-x86-64.so.2    0.080s              4.7%
[Others]                N/A                     0.658s             38.5%
Effective Physical Core Utilization: 89.5% (100.261 out of 112)
    Effective Logical Core Utilization: 45.0% (100.843 out of 224)
     | The metric value is low, which may signal a poor utilization of logical
     | CPU cores while the utilization of physical cores is acceptable. Consider
     | using logical cores, which in some cases can improve processor throughput
     | and overall performance of multi-threaded applications.
     |
Collection and Platform Info
    Application Command Line: ../lecture/20230906/mpi/allrank
    Operating System: 4.18.0-477.15.1.el8_8.x86_64 Red Hat Enterprise Linux release 8.8 (Ootpa)
    Computer Name: xb0127
    Result Size: 7.2 MB
    Collection start time: 09:24:37 21/09/2023 UTC
    Collection stop time: 09:24:38 21/09/2023 UTC
    Collector Type: Event-based counting driver,User-mode sampling and tracing
    CPU
        Name: Intel(R) Xeon(R) Processor code named Sapphirerapids
        Frequency: 2.000 GHz
        Logical CPU Count: 224
        LLC size: 110.1 MB
        Cache Allocation Technology
            Level 2 capability: available
            Level 3 capability: available

If you want to skip descriptions of detected performance issues in the report,
enter: vtune -report summary -report-knob show-issues=false -r <my_result_dir>.
Alternatively, you may view the report in the csv format: vtune -report
<report_name> -format=csv.
vtune: Executing actions 100 % done
salloc: Relinquishing job allocation 723080

exit code: 0